Enterprise Intelligence.
Delivered Autonomously.
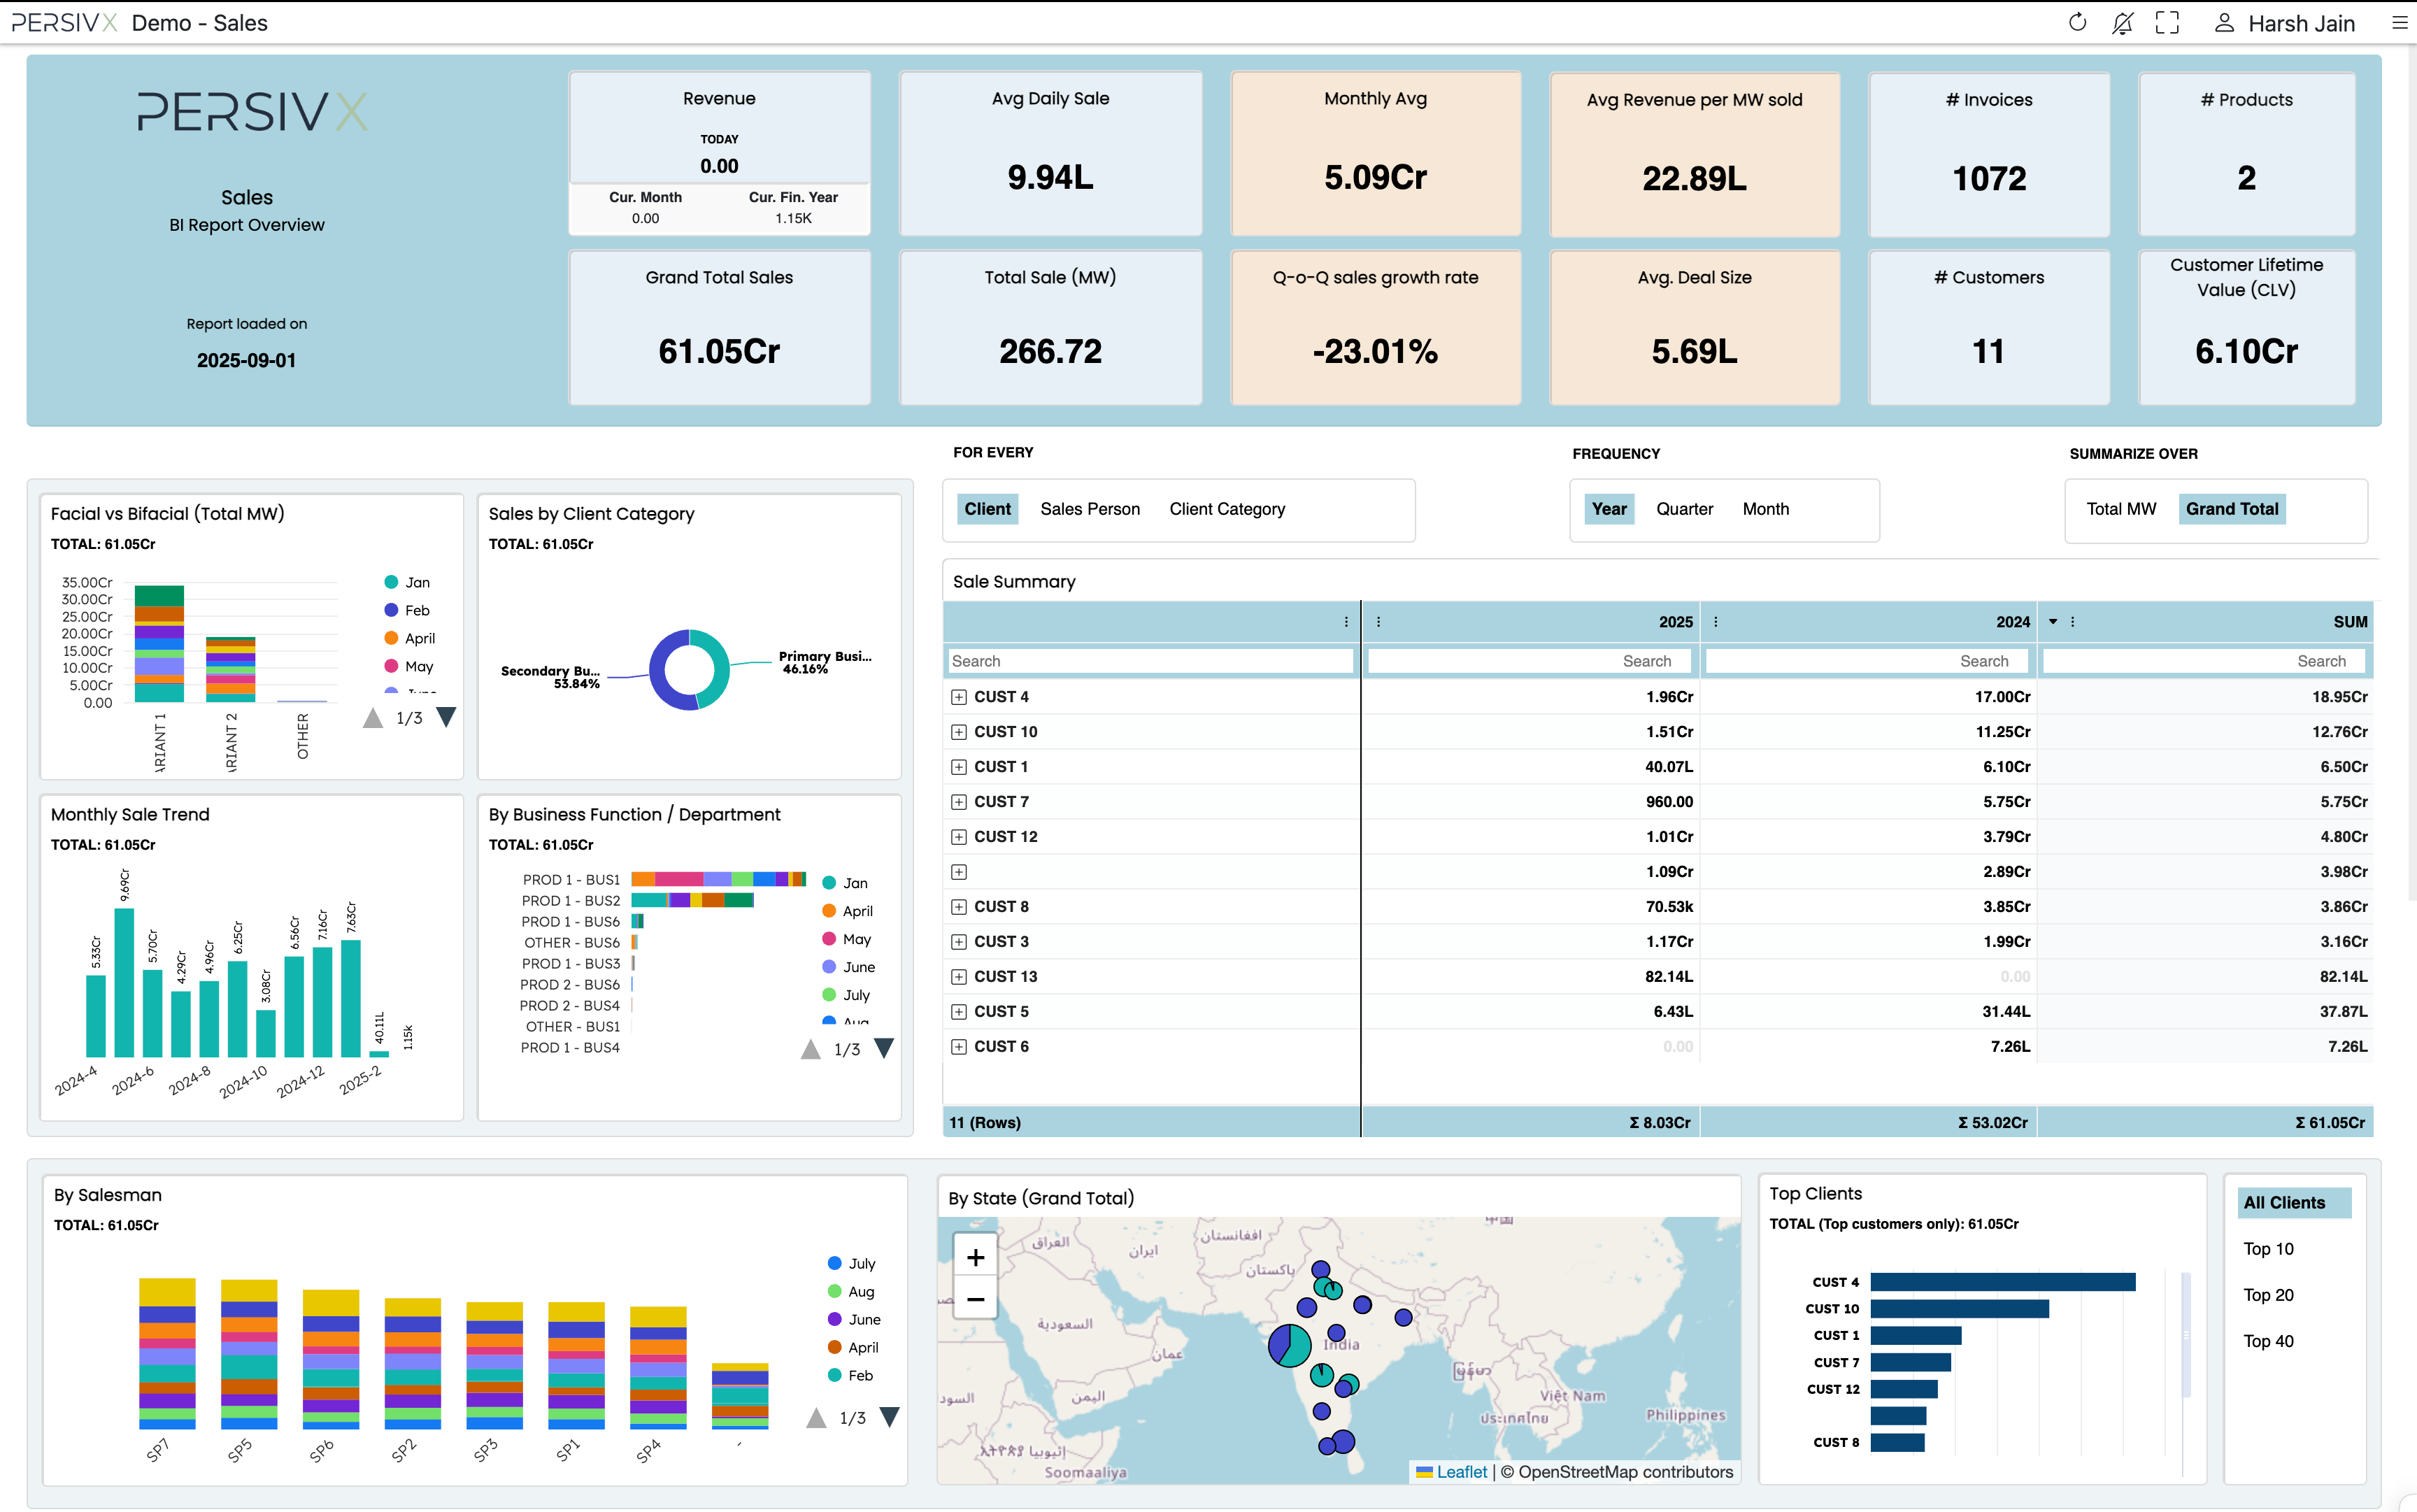
Real-time visibility across departments. Governed access at every level. Automated reporting to every channel. From setup to production in days, not quarters.
They have a discipline problem.
Reports Take Days, Not Minutes
Teams build reports by hand and still field Monday-morning requests for numbers that were true last Tuesday.
Data Lives in Five Different Tools
Sales lives in the CRM. Finance lives in SAP. Inventory lives in Excel. Nobody has one number everyone trusts.
Nothing Ships With Governance
Any analyst can push a broken report straight to 500 users - no review, no approval, no rollback.
Insight Depends on Who's Free
Without a dedicated analyst in the room, questions wait. Without a data science team, forecasts don't happen.
Ask Any Question. Get a Verified Answer.
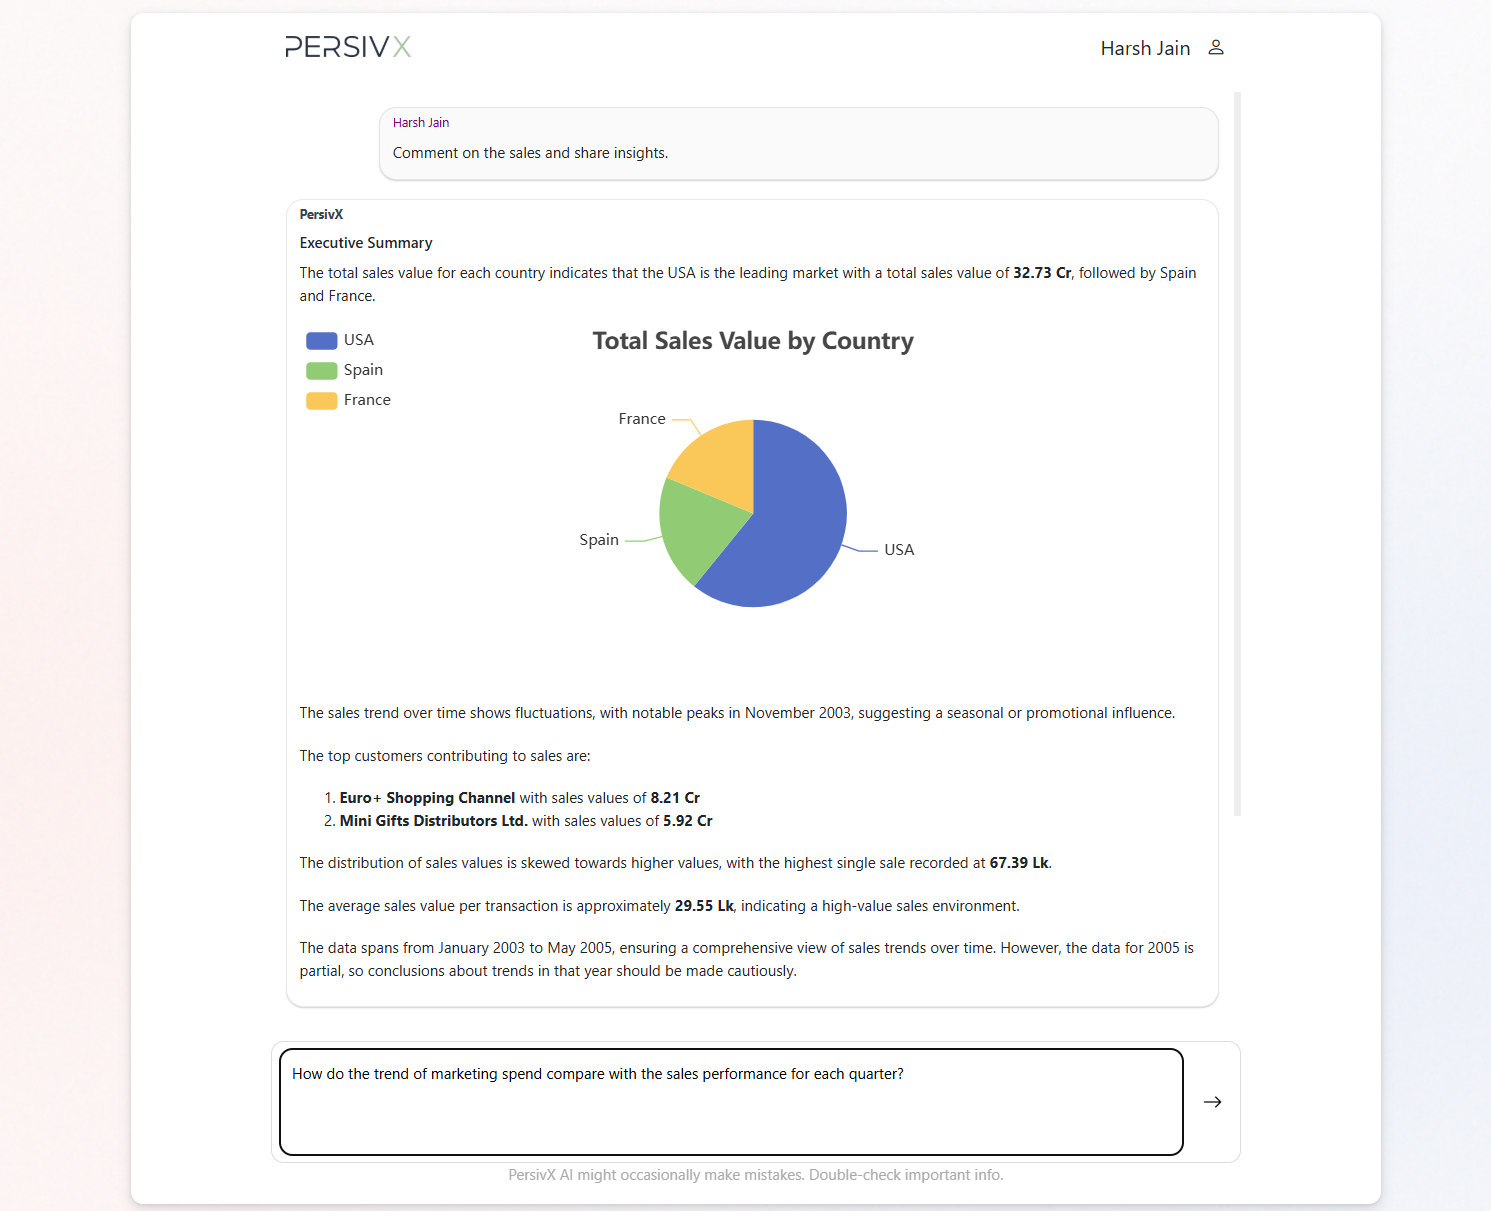
Your CFO types: “Why did margins drop in Q3?” PersivX doesn’t guess. It forms a hypothesis, queries your actual data, checks if the answer holds, refines it, and delivers a verified response with supporting visuals - in seconds. It even knows which report to look in. No analyst needed. No waiting until Monday.
Reports Ship Through Approvals
Your analyst builds a report. Before it reaches 500 users, it goes through review and approval. If something breaks, roll back in one click. Users on production never see half-finished work. This is how the best software companies ship. Now your reports ship the same way.
Governance Without Code
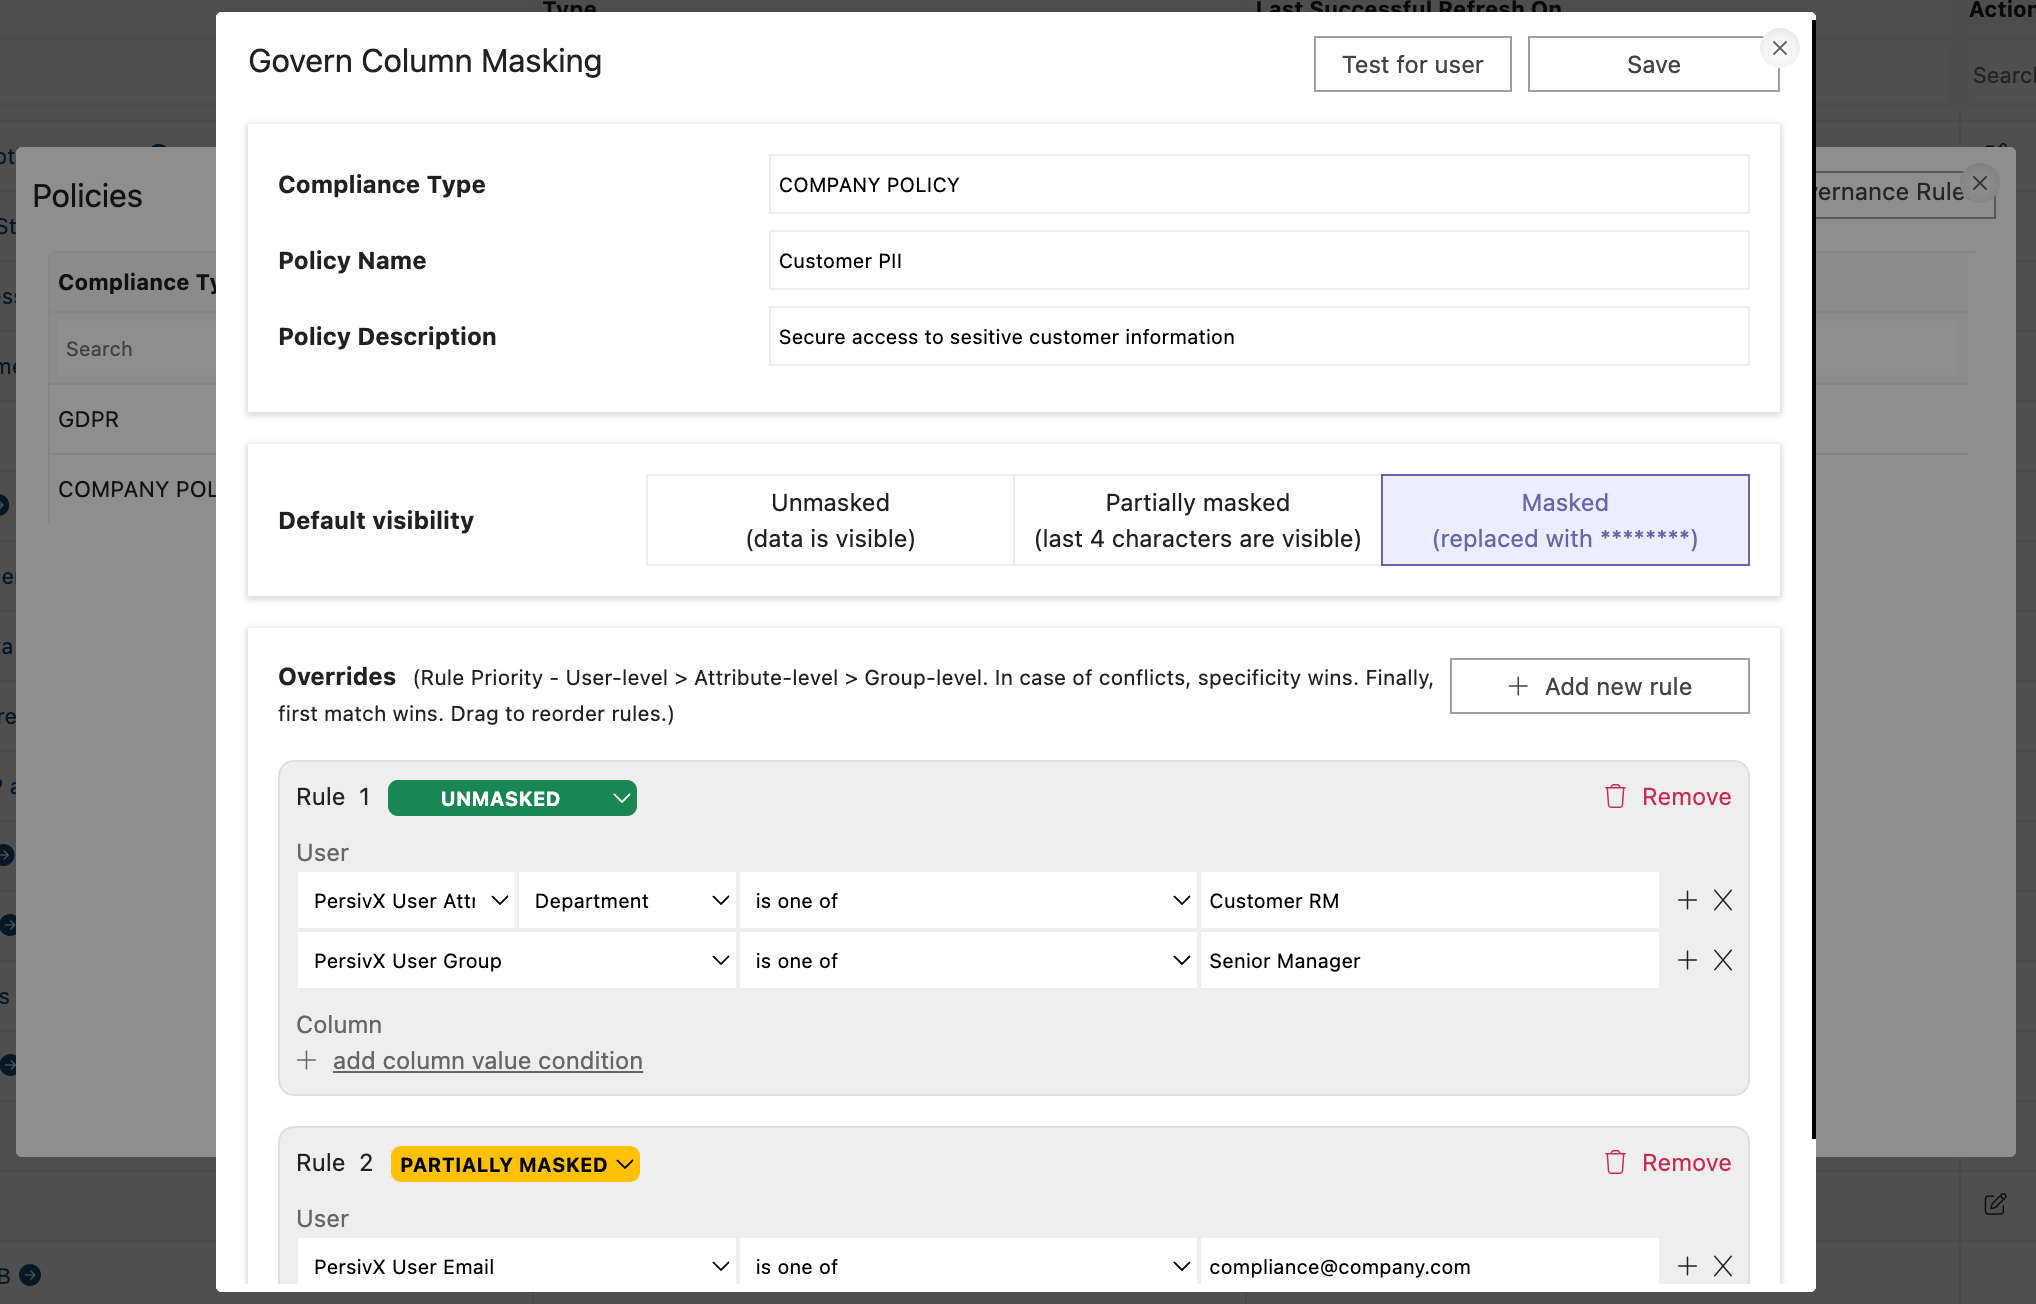
Create a policy called “PII Protection.” Apply it to 50 columns in one click. Now every user sees only what they’re allowed to - automatically. Before you publish, simulate exactly what any user will see. Every rule change is versioned. Every access is logged. Auditors love this.
Automated Alerts & Scheduled Delivery
Schedule any report to WhatsApp, Slack, Teams, Email, or Telegram - from every minute to monthly. Set conditional alerts that fire only when thresholds are crossed. Your team acts on problems before they escalate, without opening a dashboard.
All Your Data. One Report. No Middleware.
Sales lives in your CRM. Finance lives in SAP. Inventory lives in Excel. With PersivX, one report pulls from all of them live, blended, governed. No data engineers. No ETL pipelines. No 6-week integration projects.
Intelligence on Every Chart - Automatically
Build a chart. It already knows the forecast. It already spotted the anomaly. It already wrote the insight in plain English. Every visualization in PersivX is intelligent by default no configuration, no data science team, no extra cost.
Live in Days, Not Quarters
From onboarding to production dashboards in days. No 6-month implementation. No consulting army.
One Platform, Not Ten Tools
Analytics, AI, governance, automation, and delivery in one system. No integration projects. One vendor. One bill.
Enterprise-Grade Security
Role-based access, IP restrictions, audit trails, on-premise deployment. Data stays where you decide.
Automated Workflows
Scheduled reports, conditional alerts, multi-channel delivery. Your team acts on insights without logging in.
AI That Reasons, Not Guesses
Ask questions in plain English. AI queries your data, verifies the answer, and shows the evidence. No analyst needed.
Any Device, Anywhere
Desktop, tablet, phone, smart TV. Install as a standalone app. Works offline. Scales to millions of rows.
MD, ICD Dhannad - First Private Port of Central India
GM - Automation, Solex Energy Ltd.
Head of Finance, ICD Dhannad

See instantly.
Stay on top of daily operations with real-time dashboards that auto-refresh every few minutes. Cross-filtering, drill-through, and alerts ensure nothing slips through the cracks.

Understand deeply.
Blend data from any source. Drill into root causes. Anomalies are flagged automatically. Change analysis decomposes any movement into contributing factors.

Know what's next.
Every chart automatically gets time-series forecasting and trend detection. Anticipate outcomes and risks - helping you plan proactively instead of reacting late. No data science team required.

Act with confidence.
AI delivers intelligent recommendations based on your data patterns. Executive summaries generated on demand. Strategic focus areas identified automatically. Guidance that drives action.
- Automate Accounts Receivable / Accounts Payable reconciliation, auto-match invoices with POs and GRNs.
- Monitor overdue invoices, early payment discounts, duplicate invoices.
- Track consumption patterns vs procurement cycles.
Eliminates manual finance errors, improves process cycle efficiency.
- Days Sales Outstanding (DSO), Days Payable Outstanding (DPO), working capital KPIs.
- Variance analysis on spend categories, vendor performance benchmarking.
- Inventory turnover vs sales velocity.
Root cause analysis of liquidity gaps and procurement inefficiencies.
- Cash flow forecasting by scenario (delayed payments, seasonality).
- Predict vendor delays based on past SLA breaches.
- Forecast future stock-outs based on usage trends.
Reduces uncertainty in capital planning.
- Recommend payment scheduling to maximize discounts.
- Suggest credit control policies to reduce bad debts.
- Prescribe optimal reorder points & safety stock levels.
Aligns finance + procurement for Lean working capital.

- Daily pipeline monitoring, lead-to-close conversion dashboards.
- Real-time sales activity logging from CRM.
- Product/territory performance by rep.
Reduces waiting waste in pipeline visibility.
- Cohort analysis of customers by acquisition channel.
- Root cause analysis of lost deals by stage.
- Campaign ROI by channel vs cost of acquisition.
Focuses resources on high-yield segments.
- Win probability scoring based on historical conversion.
- Churn risk modeling using usage + payment data.
- Predict CLV by customer cohort.
Improves forecast accuracy & sales planning.
- Recommend next-best actions for sales reps.
- Suggest pricing adjustments to improve margin.
- Prescribe customer success interventions to prevent churn.
Maximizes customer profitability & retention.

- Track shipments across lanes with IoT integration.
- Automated stock reconciliation & discrepancy alerts.
- Monitor cycle times from supplier order → warehouse receipt.
Improves first-pass yield in logistics processes.
- Vendor scorecards: on-time %, defect %, lead-time variance.
- Route-level cost/time analysis.
- Root cause analysis of stock-outs.
Reduces defects in supply chain flow.
- Forecast demand fluctuations by region.
- Predict risk of shipment delays using weather + history.
- Anticipate slow-moving SKUs before obsolescence.
Reduces excess inventory and transport waste.
- Recommend alternative routes for cost/time optimization.
- Suggest supplier renegotiations based on performance data.
- Prescribe optimal reorder points to balance cost vs service.
Ensures just-in-time supply chain resilience.

- Track takt time adherence and production schedules.
- Downtime monitoring by machine.
- Scrap/rework dashboards.
Eliminates waiting & defect waste on shop floor.
- OEE (Availability, Performance, Quality) across lines.
- Six Sigma defect metrics (DPMO, Sigma level).
- Root cause analysis of downtime & bottlenecks.
Identifies variance sources in production processes.
- Machine failure predictions via sensor/IoT data.
- Forecast demand-driven production capacity.
- Simulate production delays under different load scenarios.
Improves uptime & throughput predictability.
- Suggest preventive maintenance intervals.
- Recommend line balancing for optimized cycle times.
- Prescribe lean kaizen events for bottleneck elimination.
Improves throughput and reduces cycle time.

- Track stock levels, bin accuracy, and cycle counts.
- Monitor picking/packing errors.
- Space utilization heatmaps.
Improves process cycle efficiency in warehouse ops.
- Stock aging & obsolescence analysis.
- Shrinkage root cause analysis.
- SKU profitability analysis vs carrying cost.
Cuts inventory waste & highlights non-value SKUs.
- Forecast seasonal demand for warehouse space.
- Predict picking error likelihood by SKU complexity.
- Anticipate obsolescence risk for slow-moving items.
Improves warehouse planning & reduces dead stock.
- Recommend optimal layout (ABC analysis, slotting).
- Suggest error-proofing (Poka-Yoke) in picking.
- Prescribe reorder logic (Kanban, JIT replenishment).
Boosts throughput and reduces stock-outs.

- Milestone progress, Gantt adherence.
- Resource utilization dashboards.
- Budget burn-down tracking.
Improves visibility and reduces rework cycles.
- Cost vs plan variance.
- Earned Value Analysis (EVA).
- Root cause of schedule slippage.
Identifies true drivers of project variance.
- Timeline forecasts based on resource velocity.
- Predict risk of scope creep.
- Estimate probability of budget overrun.
Enhances schedule predictability & risk planning.
- Suggest corrective actions for delayed milestones.
- Recommend reallocation of critical path resources.
- Prescribe mitigation actions for top project risks.
Ensures delivery with minimal variance.

- Unified dashboards across Finance, Sales, Ops.
- Cross-functional KPI monitoring.
Provides single source of truth for leadership.
- Benchmark internal KPIs vs industry.
- Operational Efficiency Index across BUs.
Pinpoints underperforming departments.
- Forecast inter-departmental bottlenecks.
- Predict future cost/revenue impact of misalignment.
Prevents inefficiency from cascading.
- Recommend reallocation of capital.
- Suggest cross-unit process alignment.
Ensures strategic alignment with enterprise goals.

- Setup Policies: Create / update policies using our intuitive Governance UI.
- Apply Everywhere: Decide which columns and attributes to govern, and PersivX applies policies across all reports automatically.
- Monitored Application: Every policy is applied automatically, and each action is logged for full visibility.
- Fully Auditable: Every policy change is versioned - compliance teams can track, review, and audit data directly from the UI.
- Instantly Usable: Access governed data anywhere - secure, seamless, and ready for action.